Create Dashboard For Your Story Node
When I was setting up the story node for the first time, I found something interesting along the way. There’s a configuration for…

When I was setting up the story node for the first time, I found something interesting along the way. There’s a configuration for Prometheus, which I knew could be used with Grafana to create some nice, colorful charts and dashboards. After my node was stable for a while, I started digging into it, and finally, voilà!
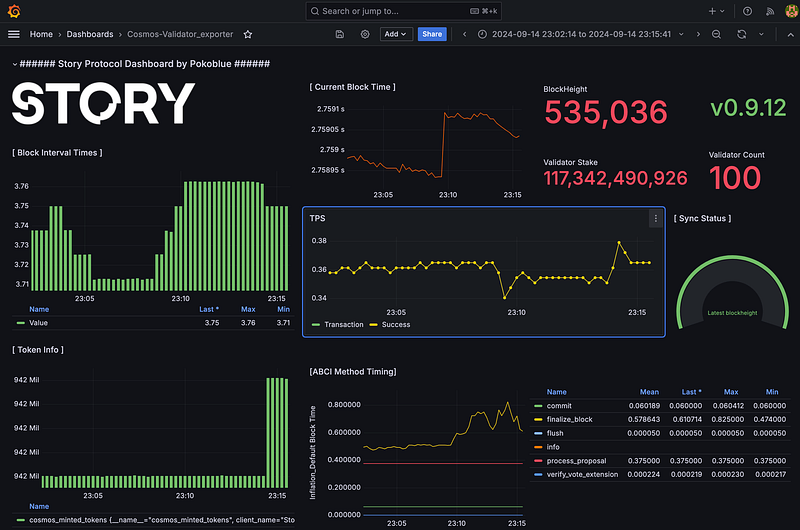
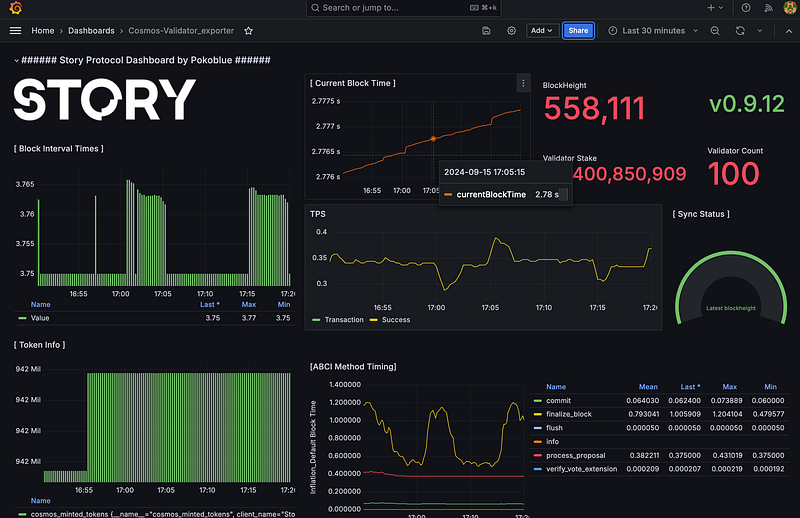
Here is the result:
And here’s the configuration diagram behind the scenes. If it looks complicated, don’t worry — I’ll do my best to explain it as much as I can.

First things first, you’ll need to install Grafana and Prometheus. It might sound complicated, but believe me, if I can do it, so can you! Before diving into the details, let me give you a quick overview:
There are three main components working together: Grafana, Prometheus, and Node Exporter.
- Grafana: For dashboard visualization.
- Prometheus: For data collection.
- Node Exporter: Acts as the agent on each target server.
We’ll be using both the Node Exporter and the built-in Prometheus metrics in the Story Node.
Workflow: Node Exporter → Prometheus → Grafana
Alright, let’s get started! 😊
1. Install Prometheus
Prometheus is an awesome open-source monitoring tool I’ve been using lately. Think of it as a system that collects real-time metrics from your server — like CPU usage or memory consumption — every five minutes. What’s really cool is that it can integrate with Grafana, allowing you to create dynamic dashboards to visualize everything.
I’m currently using Prometheus V2.54.1. There’s a V3 beta release available, but I haven’t tried it yet because I’m concerned about backward compatibility. If you decide to try V3, please let me know how it works for you! From the release notes, it looks like there are some significant changes in the UI and PromQL queries.
#create user for prometheus
sudo useradd --no-create-home --shell /bin/false prometheus

#make directory
mkdir prometheus

#download binary V2.54.1
wget https://github.com/prometheus/prometheus/releases/download/v2.54.1/prometheus-2.54.1.linux-amd64.tar.gz

#unzip
tar xvf prometheus-2.54.1.linux-amd64.tar.gz

#post download clean up
#make directory
sudo mkdir /etc/prometheus
sudo mkdir /var/lib/prometheus

#move file
cd prometheus-2.54.1.linux-amd64
sudo mv prometheus /usr/local/bin/
sudo mv promtool /usr/local/bin/
sudo mv prometheus.yml /etc/prometheus/
sudo mv consoles /etc/prometheus/
sudo mv console_libraries /etc/prometheus/

#set ownership
sudo chown -R prometheus:prometheus /etc/prometheus
sudo chown prometheus:prometheus /usr/local/bin/prometheus
sudo chown prometheus:prometheus /usr/local/bin/promtool
sudo chown -R prometheus:prometheus /var/lib/prometheus
Next I will create system service file
sudo nano /etc/systemd/system/prometheus.serviceCopy and paste:
[Unit]
Description=Prometheus Monitoring
Wants=network-online.target
After=network-online.target

[Service]
User=prometheus
Group=prometheus
Type=simple
ExecStart=/usr/local/bin/prometheus \
  --config.file /etc/prometheus/prometheus.yml \
  --storage.tsdb.path /var/lib/prometheus/ \
  --web.console.templates=/etc/prometheus/consoles \
  --web.console.libraries=/etc/prometheus/console_libraries

[Install]
WantedBy=multi-user.target
Load and start service
sudo systemctl daemon-reload
sudo systemctl start prometheus
sudo systemctl enable prometheus

#test
sudo systemctl status prometheus
All set? Time to test it out! The default port for Prometheus is 9090. Let’s access the UI by opening your web browser and navigating to:
http://<your-server-ip>:9090
Replace <your-server-ip> with your server IP or localhost. This should bring up the Prometheus interface, where you can start exploring the metrics!

Voilà! Next, we’ll move on to installing Node Exporter, but don’t worry — we’ll come back later to handle the configuration.
2. Install Node Exporter
Node Exporter is an additional binary created by the Prometheus team to collect metrics from the target server. In this case, we’ll install it on the Story Node’s server. It’s a simple, lightweight binary that you can run directly, but we’ll set it up as a service to make maintenance easier in the long run.
# Create a node_exporter user
sudo useradd --no-create-home --shell /bin/false node_exporter

# Download Node Exporter v1.3.1
cd /tmp
wget https://github.com/prometheus/node_exporter/releases/download/v1.3.1/node_exporter-1.3.1.linux-amd64.tar.gz

# Extract the archive
tar xvf node_exporter-1.3.1.linux-amd64.tar.gz

# Move the binary to /usr/local/bin
sudo mv node_exporter-1.3.1.linux-amd64/node_exporter /usr/local/bin/

# Set ownership to node_exporter user
sudo chown node_exporter:node_exporter /usr/local/bin/node_exporter

# Clean up the downloaded files
rm -rf node_exporter-1.3.1.linux-amd64*
Create service file
# Create and open the service file
sudo tee /etc/systemd/system/node_exporter.service > /dev/null <<EOF
[Unit]
Description=Node Exporter
Wants=network-online.target
After=network-online.target

[Service]
User=node_exporter
Group=node_exporter
Type=simple
ExecStart=/usr/local/bin/node_exporter

[Install]
WantedBy=multi-user.target
EOF
Start node exporter
# Reload systemd to recognize the new service
sudo systemctl daemon-reload
# Start the node_exporter service
sudo systemctl start node_exporter
# Enable the service to start on boot
sudo systemctl enable node_exporter
# Verify that node_exporter is running
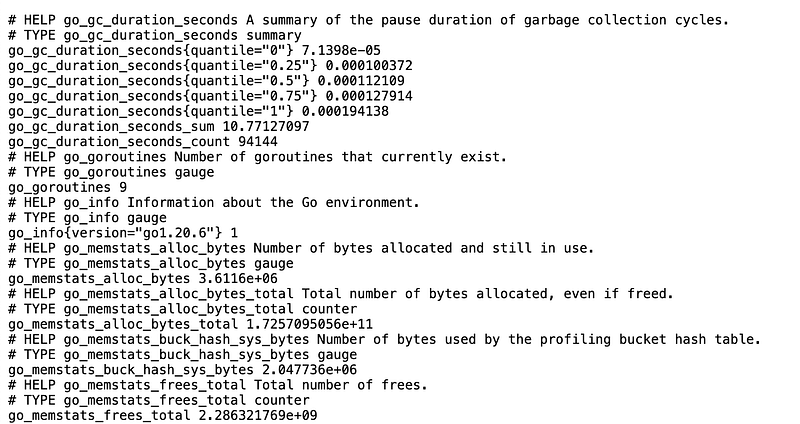
sudo systemctl status node_exporterTest it!!! The default port is 9100.
http://<your-story-node-ip>:9100/metrics
You should get something like this.
Next, let’s complete the installation of Grafana first. Once that’s done, we’ll go back and configure everything to work together smoothly.
3. Grafana Installation
I see Grafana as something like Tableau for server admins. It’s not exactly built for data analytics, but it does a fantastic job of visualizing data through charts and dashboards. We’ll configure Prometheus as the data source in the next step.
Now, let’s head back to the monitoring server and install Grafana.
# Update package list and install prerequisites
sudo apt-get update
sudo apt-get install -y apt-transport-https software-properties-common wget

# Add Grafana GPG key
wget -q -O - https://packages.grafana.com/gpg.key | sudo apt-key add -

# Add Grafana repository
sudo add-apt-repository "deb https://packages.grafana.com/oss/deb stable main"

# Update package list again
sudo apt-get update

# Install Grafana
sudo apt-get install -y grafana

# Start and enable Grafana service
sudo systemctl start grafana-server
sudo systemctl enable grafana-server

# Verify Grafana is running
sudo systemctl status grafana-server
Go ahead and test it! The default port for Grafana is 3000.
To access the Grafana UI, open your web browser and navigate to:
http://<your-server-ip>:3000
Use the default login credentials:
- Username:
admin - Password:
admin(You’ll be prompted to change this after your first login.)
Once logged in, you’re all set to start configuring your dashboards!

4. Configuration
After you’ve installed everything, this is the last major step to make everything work together. Let’s start with configuring Prometheus, and we’ll circle back to Grafana afterward. As for Node Exporter, there’s nothing more to do — just install it and forget about it, unless you want to add additional non-default metrics, which you can customize if needed.
Before we start configuring Prometheus, there’s one setting I mentioned earlier that needs to be enabled in the Story client configuration.
4.1 Enable metric in story client
Make sure you turn this on — it’s equivalent to the Node Exporter, but the metrics are directly related to the Story network and your node. This configuration will allow Prometheus to collect all the relevant data from your Story node.
#got to config file in your story node
cd ~/.story/story/config

#edit
sudo nano config.toml
The configuration related to Prometheus is located near the end of the file. Make sure to change it to the following:
# When true, Prometheus metrics are served under /metrics on
# PrometheusListenAddr.
# Check out the documentation for the list of available metrics.
prometheus = true

# Address to listen for Prometheus collector(s) connections
prometheus_listen_addr = ":26660"
This will enable Prometheus to properly collect metrics from your Story node. Then, reload config and restart your node.
#stop service
sudo systemctl stop story
# Change 'story' to the full path if necessary, e.g., /usr/local/bin/story
story init --network iliad --moniker pokoblue
#start service
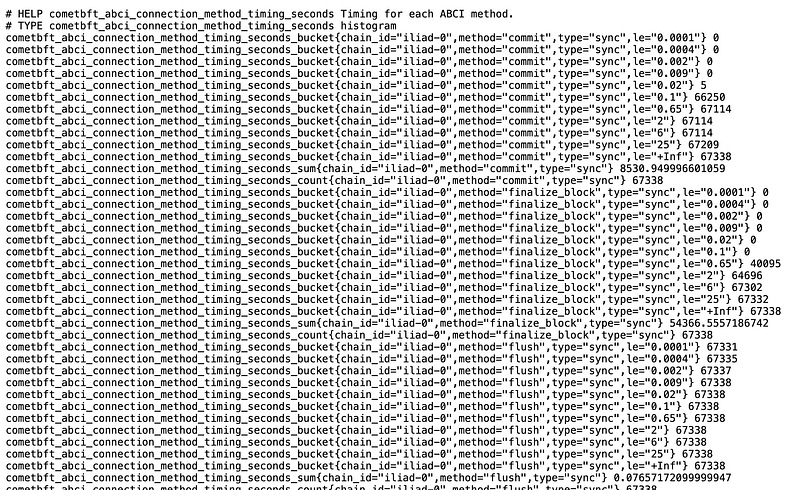
sudo systemctl start storyTime to test. Just open a web browse. Default port is 26660.
url: http://<your-Story-node-ip>:26660
You should get something like this:
4.2 Setup Prometheus
The Prometheus configuration is straightforward and located in a configuration file. The default setup isn’t complicated — it mainly defines the server IP and port.
Head back to the monitoring server and edit the config file.
#go to directory
cd /etc/prometheus

#edit
sudo nano prometheus.yml
Here’s a basic example:
global:
  scrape_interval: 15s  # Set the scrape interval to 15 seconds

scrape_configs:
  - job_name: 'story-node'
    static_configs:
      - targets: ['<your-story-node-ip>:26660']

  - job_name: 'node-exporter'
    static_configs:
      - targets: ['<your-stor-node-ip>:9100']
After save, you must restart the service.
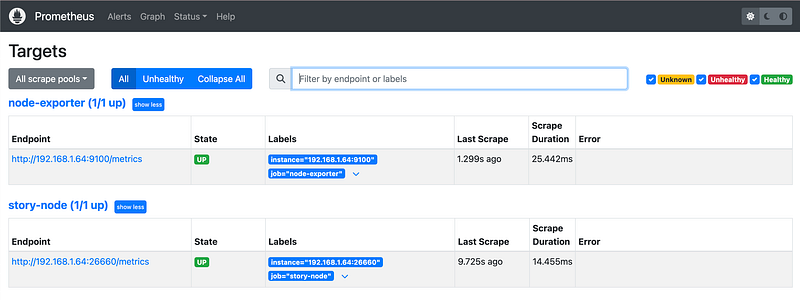
sudo systemctl restart prometheusThat should work. Before we move on to Grafana, let’s make sure Prometheus is functioning correctly. You can do this by opening your browser and navigating to the Prometheus UI using the URL and port mentioned in step 1 above.

Select Menu: Status → Targets
Then, you should get something like this.
4.3 Set up Prometheus as a data source in Grafana
Next, go to the Grafana dashboard and add a new Prometheus connection. Remember, the default port for Grafana is 3000.
Grafana Menu → Connections → Add new connection
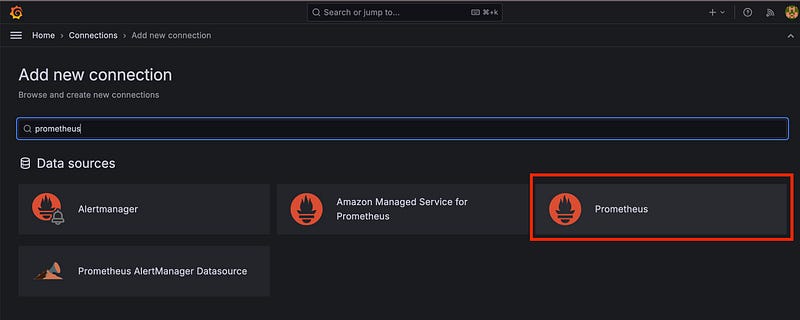
Then, click Prometheus. After that, you specify connection name, prometheu server URL and port:

There are also other configurations, but we can skip them for now. Scroll down to the bottom to test and save.
4.4 Grafana dashboard config
After you set up the connection, everything is ready. Next, we will configure our dashboard. I’m also new to this, so it may not be perfect, but I hope it will be a good start for you.
Select Grafana menu → New Dashboard → Import Dashboard.
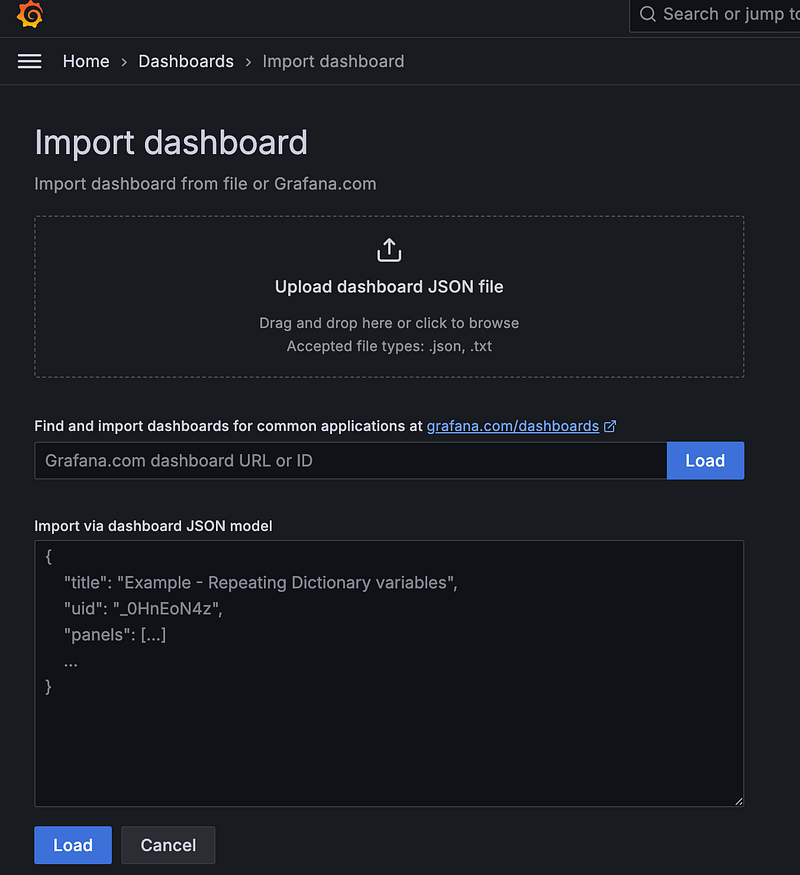
There are 3 options:
- Upload JSON (.json or .txt) ← We will use this option.
- Load Grafana url or ID
- Import via dashboard JSON model.
I have export my dashboard link into a JSON. You can reuse and upload it.
Then, specify dashboard name & UID. You can type anything just not duplicate to existing name or UID. Next, click import.
Important: Please select Prometheus as the data source (see the picture below).

Congratulation, you have been successfully import your dashboard.
Up to this point, I hope you’re having fun adding and editing your own dashboard! If you’d like to showcase your dashboard, please feel free to leave a comment here or on my Twitter.
Pokoblue Twitter: https://x.com/PokoBlue99
That’s all for today. Thank you for reading!